I’ve had a bug lately about lung volumes and I guess that today is no different. A report with some odd lung volume results came across my desk and I’ve spent some time trying to figure out what the numbers are telling me about test quality.
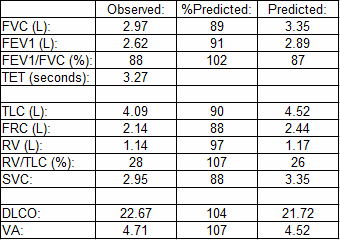
What concerned me was the 15% discrepancy between the VA from the DLCO and the TLC measured by plethysmography. VA is measured from the insoluble component of the DLCO gas mixture (methane in this case) and is almost always less than TLC. VA is a single-breath measurement and for VA and TLC to be close this usually means the patient must have very good gas mixing inside their lungs. Even when the quality of the DLCO and lung volume tests are good however, VA is almost always less than TLC. So why was VA so much larger than TLC in this case?
I first checked to see if there was a problem with the calculation of VA. Patients can perform the DLCO test erratically and it was possible that a single marginal test had been selected. This was not the case as the patient had performed three DLCO tests (one with questionable quality and two with good quality) and since the VA did not vary by more than 3% across all of the tests it was evident that the VA was eminently reproducible.
Usually when there is any maldistribution of ventilation this can be seen in the single-breath DLCO test by a tracer gas concentration that steadily decreases during the exhalation phase. When this occurs the tracer gas concentration in the standard ATS-ERS alveolar sample is the highest during the entire exhalation and therefore VA tends to be on the low side. On very rare occasions however (probably less than 1 in a 1000 DLCO tests and only in patients with pulmonary fibrosis) I have observed the exhaled tracer gas showing the opposite pattern. That is, the tracer gas concentration is lowest at the beginning of exhalation and increases as exhalation continues. When this occurs VA can be higher than TLC but there is a distinct tracer gas waveform that goes along with it. This patient’s exhaled gas waveforms were normal and even showed a slight decline during exhalation which was more suggestive of a small amount of the kind of ventilation inhomogeneity you see with airway obstruction or normal aging.
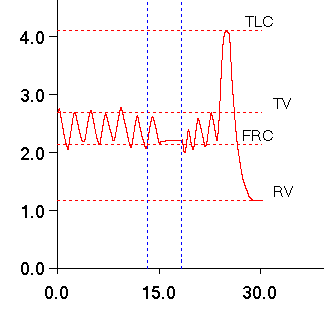
Next I looked at the plethysmography TGV tracings. Plethysmograph is another test that many patients find difficult and the lab’s technicians are occasionally hesitant to override the software’s calculations so it was possible that TGV was being underestimated by poor test quality. Once again however, there were three good quality TGV efforts and TLC did not vary more than 2% across all of the tests. The TGV waveforms were clean and the measured slope for each effort was spot-on as far as I could tell. When I looked at the slow vital capacity however, I was bothered by the fact that the exhalation seemed to be chopped-off, like the test had been ended too soon and the patient hadn’t finished exhaling.
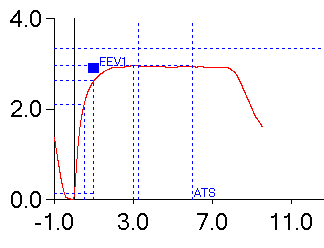
This was curious because the SVC and FVC were essentially the same. When I finally looked at the spirometry effort (this, by the way, is opposite to the pattern that I usually use to review reports but the VA and TLC had caught my eye immediately and I was reviewing the report backwards) and there it was obvious the patient had not exhaled completely and that FVC was likely underestimated.
Since most patients have little or no problem performing a full inhalation to TLC as a general rule of thumb I believe that when FVC and SVC are underestimated this means that it is usually the ERV that is underestimated, not the IC. When this logic is applied to lung volume measurements this means that it is the RV that is usually overestimated and not the TLC that is underestimated. In this case I am forced to believe that the patient had both a suboptimal inhalation and a suboptimal exhalation and that the difference between the reported FVC and their “real” FVC may be substantial. This also means that the FEV1/FVC ratio was probably overestimated and that the patient therefore also had some mild airway obstruction which might explain the slight decline in tracer gas during exhalation in the DLCO test.
The patient was in their 20’s with a new diagnosis of scleroderma and a non-smoker. They had been complaining of SOB and had never had any pulmonary function tests previously. Interstitial disease often goes along with scleroderma but given the results and the doubts about FVC and TLC a component of asthma may be more likely. It is also likely that there was some testing naivete and that the patient just needs more practice to know what a full inhalation and a full exhalation are really like.
The final read on this report was “Normal lung volumes and gas exchange. Although spirometry results are within normal limits the FVC is likely underestimated due to an early termination of exhalation and for this reason an obstructive defect cannot be excluded.”
VA should never be more than TLC. When it is, listen to it because it is trying to tell you something about test quality.

PFT Blog by Richard Johnston is licensed under a Creative Commons Attribution-NonCommercial 4.0 International License.