
Dozens of articles have been written about the correlation between different abnormal flow-volume loop contours and pulmonary disorders. In contrast very little has ever been written about what constitutes a normal flow-volume loop and what this looks like has been primarily anecdotal.
Interestingly, the ATS/ERS standard for spirometry includes an example of a “normal” flow-volume loop but its source and what makes it normal is not explained.
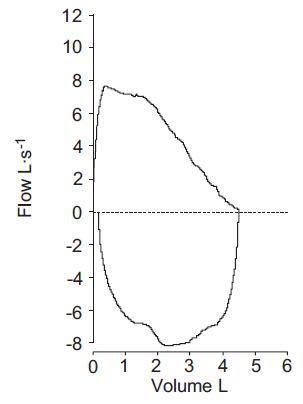
From the ATS/ERS standard on spirometry, page 327.
One feature that is commonly seen as a feature of normal flow-volume loops has been variously called a ‘shoulder’ or ‘knee’.

The cause of the ‘shoulder’ is unknown but has been speculated to be due to flow limitation in the trachea. If this is true then a ‘shoulder’ is actually a sign of a limitation in peak flow rather than as a prolongation of peak flow.
A recent article used results from a large population study to explore this particular flow-volume loop feature and were able to show that in general it was associated with normal or above normal FEV1/FVC ratios. They also showed it was more common in younger individuals than older, and more common in females than in males.
So, a ‘shoulder’ is associated with normal spirometry but if FEV1 and the FEV1/FVC ratio are to be used as the way to determine normalacy, because this specific contour does not occur in all individuals with normal spirometry it cannot be considered to be the only ‘normal’ contour. For example, this loop comes from a relatively young female:
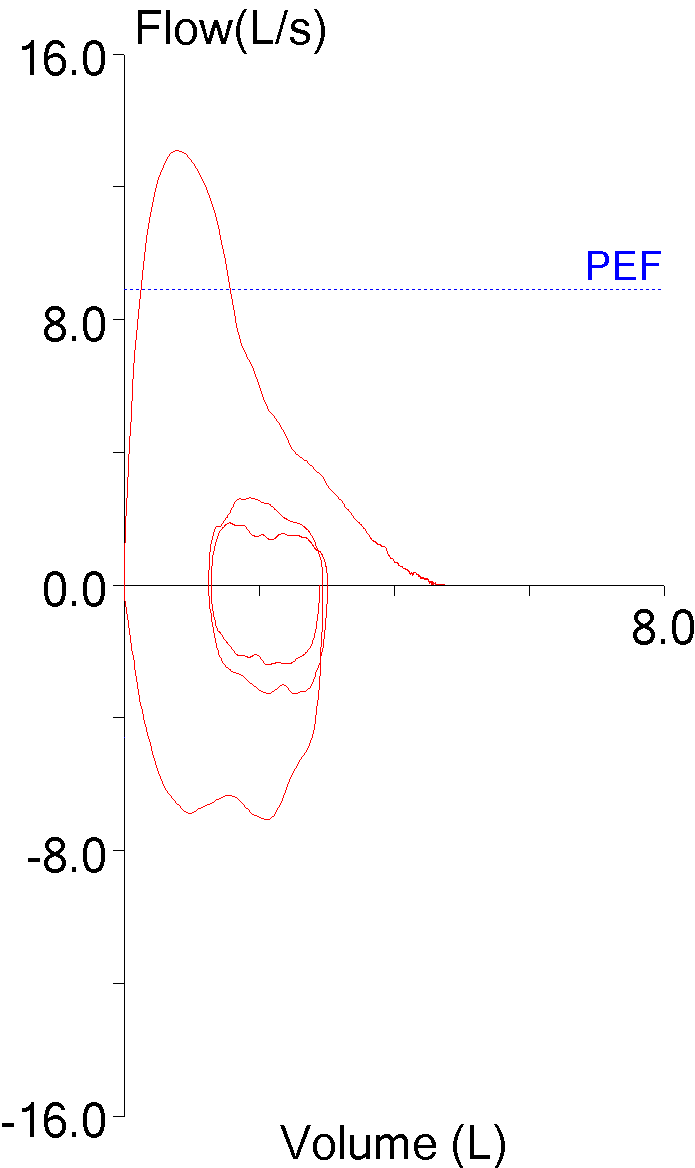
| Observed: | %Predicted: | |
| FVC: | 4.81 | 109% |
| FEV1: | 3.95 | 109% |
| FEV1/FVC: | 82 | 101% |
| PEF: | 13.07 | 147% |
Flow-volume loops associated with airway obstruction have a concave expiratory contour are usually described with some degree of ‘scooping’ or ‘coving’. Despite the ‘scooping’ in this loop, the results are actually normal, so this contour’s association with airway obstruction is not a given. For reasons of accuracy therefore, instead of describing a flow-volume loop as ‘normal’ it would be better to describe its contour objectively.
During an exhalation the force that can be applied by the respiratory muscles and the lung’s elastic recoil are greatest near TLC. These combined forces decrease as lung volume decreases towards RV. Airway resistance on the other hand, is lowest at TLC and increases as the airways are compressed when lung volume decreases towards RV. Along with gas density these two factors are primarily responsible for the shape of the maximal flow-volume loop but the exact physiology of how they relate to the various distinctive contours of flow-volume loops is often unclear.
Even so, flow-volume loop contours can be exceptionally useful in the interpretation of spirometry results. If the reason for some contours is not as well understood as it should be at least their associations with specific lung disorders is often well characterized. One problem with this is that although certain lung disorders usually occur with a specific flow-volume loop contour, specific flow-volume loop contours do not only occur with specific lung disorders.
So, are there ‘normal’ flow-volume loops? Yes, but they can be concave, convex or flat. Instead of using ‘normal’ as a way of describing a flow-volume loop it’s probably better to use the more objective and descriptive terms “shoulder”, “scooping” or “flat”.
References:
Brusasco V, Crapo R, Viegi G. ATS/ERS Task Force: Standardisation of lung function testing. Standardisation of spirometry. Eur Respir J 2005; 26: 319-338.
Shin HH, Sears MR, Hancox RJ. Prevalence and correlates of a ‘knee’ pattern on the maximal flow-volume loop in young adults. Respirology 2014; 19: 1052-1058

PFT Blog by Richard Johnston is licensed under a Creative Commons Attribution-NonCommercial 4.0 International License