
We’ve had some questions lately about some of our CPET guidelines. These questions were informational in nature not confrontational but they served to remind us that the reference values we use for CPET interpretation were developed and put in place at least ten years ago and it is past time they were reviewed. As a starting point I’ve been re-reading the ATS-ACCP and AHA statements on cardiopulmonary exercise testing. One sentence from the AHA statement concerning the Ve-VCO2 slope caught my eye. Specifically:
“… calculation of the Ve/VCO2 slope with all exercise data obtained from a progressive exercise test (initiation to peak effort) appears to provide additional clinical information compared with submaximal calculations (i.e. those that use linear data points before the steepening associated with ventilatory compensation for metabolic acidosis).”
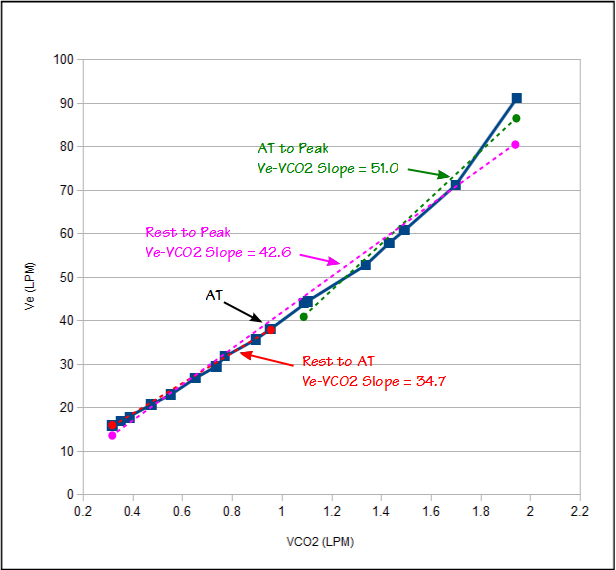
Ve-VCO2 slope is calculated using a linear regression function and we have been calculating it using only the test data between the start of exercise and the anaerobic threshold. The AHA statement however says we should be calculating it using the data all the way up to peak exercise (the ATS/ACCP statement is mute on this point since it does not even discuss Ve-VCO2 slope other than as a graph). Because Ve-VCO2 slope is a key component in our assessment of CPET results it is important that we get this right.
Ve and VCO2 have a reasonably linear relationship up to the anaerobic threshold. After the anaerobic threshold ventilation is driven by acidosis as well as CO2. This means that the Ve-VCO2 slope tends to be steeper (greater change in Ve per unit of VCO2) after anaerobic threshold than it was before. A Ve-VCO2 slope calculated from the entire CPET will therefore have steeper slope than one calculated using just using rest to AT.
For decades the peak VO2 from an exercise test has been used to assess surgical risk and as a predictor of mortality and hospitalization. One particularly valid criticism in the use of peak VO2 is that it can be falsely reduced for reasons that have nothing to do with either cardiac or pulmonary status. Research has shown that the Ve-VCO2 slope is probably a better indicator than peak VO2 and since the Ve-VCO2 slope from rest to AT is linear this means that an accurate Ve-VCO2 slope can be obtained from even a submaximal exercise test. This is one of the reasons that I had thought the consensus was that Ve-VCO2 slope should be calculated only using data up until AT.
When I reviewed the literature referenced in the AHA statement I found several studies that indicate that although the start to AT (sub-maximal) Ve-VCO2 slope was a powerful predictor of an individual’s clinical outcome, the start to peak Ve-VCO2 slope was superior. The reasons for this are not completely clear but it was speculated that it is due to poorer cardiac function at higher levels of exercise which leads to greater acidosis and a steeper Ve-VCO2 slope after anaerobic threshold. At least one study indicated that the difference between the sub-maximal Ve-VCO2 slope and the Ve-VCO2 slope after AT was itself a significant predictor of outcome, and that the greater the difference, the poorer the outcome was.
It does seem to make sense therefore, to calculate Ve-VCO2 from start to peak exercise. One concern I have with this approach would be that the peak Ve-VCO2 slope, like peak VO2, is dependent on patient effort. For this reason it is somewhat unclear what its normal range is. The upper limit of normal for the sub-maximal Ve-VCO2 slope is considered to be 34. The peak Ve-VCO2 slope should always be greater than the sub-maximal Ve-VCO2 slope and for this reason it should probably not have the same upper limit of normal. The AHA statement is a bit vague on this point in that it says that a peak Ve-VCO2 slope less than 30 is normal and one greater than 40 is abnormal, leaving the actual upper limit of normal somewhat up in the air. This is something that needs further research since I have seen several studies using peak Ve-VCO2 slope that used an ULN of 34.
An additional concern is that the Ve-VCO2 slope is calculated using linear regression. This is certainly acceptable for a sub-maximal Ve-VCO2 slope but the Ve-VCO2 slope from an entire CPET is not linear. This leaves open to question exactly what the numerical value that is calculated for a peak Ve-VCO2 slope is really saying. It seems to me there are probably better ways to characterize the peak Ve-VCO2 slope other than linear regression but since I am not a statistician or mathematician I will have to wait for somebody else to address this issue.
For my lab it seems the best approach will be to continue to calculate the sub-maximal Ve-VCO2. Its upper limit of normal is reasonably well characterized and it is also well suited to assessing sub-maximal tests. In addition however, I will also start calculating the peak Ve-VCO2 slope and will use the AHA value of 40 as the upper limit of normal. This should also be a useful check on those times when the anaerobic threshold is indeterminate. I will be interested to see if there are any patients who have a normal sub-maximal Ve-VCO2 slope but an abnormal peak Ve-VCO2 slope, or if both slopes will always be abnormal. This is something I haven’t seen addressed in any studies.
Twenty-five years ago we only reported the Ve/VCO2 at AT but since then it has gotten more complicated. Now we report the Ve/VCO2 at AT, the lowest observed Ve/VCO2, the sub-maximal Ve-VCO2 slope and the peak Ve-VCO2 slope. I would like to pare these down but it’s difficult to determine which of these values, if any, should be dropped. There are proponents for each of these measurements but only a few studies that have compared each approach and these have been primarily limited to the ability to prognosticate survival or hospitalization rates and not particularly towards the causes of the differences. The relationship between Ve and VCO2 is multi-factorial and it is possible that each of these measurements is saying something slightly different about patient physiology. It’s also just as possible that they overlap each other and that a single measurement (peak Ve-VCO2 slope?) would be sufficient but at this moment the jury is still out.
References:
Arena R, Myers J, Aslam SS, Varughese EB, Peberdy MA. Technical considerations related to the minute ventilation/carbon dioxided output slope in patients with heart failure. Chest 2003; 124: 720-727.
ATS/ACCP Statement on cardiopulmonary exercise testing. Am J Resp Crit Care 2003; 167: 211-277.
Balady GJ; et al. Clinician’s guide to cardiopulmonary exercise testing in adults: A scientific statement from the American Heart Association. Circulation 2010; 122: 191-225.
Chua TP, Ponikowski P, Harrington D, Anker SD, Webb-Peploe K, Clark AL, Poole-Wilson PA, Coats AJS. Clinical correlates and prognostic significance of the ventilatory response to exercise in chronis heart failure. J Am Coll Cardiol 1997; 29: 1585-1590.
Corra U, Mezzani A, Bosimini E, Scapellato F, Imparato A, Giannuzzi P. Ventilatory response to exercise improves risk stratification in patients with chronic heart failure and intermediate functional capacity. Am Heart J 2002; 143: 418-426.
Ingle L, Goode K, Carroll S, Sloan R, Boyes C, Cleland JGF, Clark AL. Prognostic values of the Ve/VCO2 slope calculated from different time intervals in patients with suspected heart failure. Int J Cardiol 2007; 118: 350-355.
Koike A, Itoh H, Kato M, Sawada H, Aizawa T, Fu LT, Watanabe H. Prognostic powere of ventilatory responses during submaximal exercise in patients with chronic heart disease. Chest 2002; 121: 1581-1588.
Sun XG, Hansen JE, Garatachea N, Storer TW, Wasserman K. Ventilatory efficiency during exercise in healthy subjects. Am J Resp Crit Care Med 2002; 166: 1443-1448.

PFT Blog by Richard Johnston is licensed under a Creative Commons Attribution-NonCommercial 4.0 International License