
Although the authors of the Global Lung Function Initiative (GLFI) study acknowledge the effect of height on their reference equations the range and distribution of heights in its study populations was not included in the report. This was a similar problem for the NHANESIII reference equations since the height range was never reported within the text of the original report however it did include scatter graphs showing the range of heights. These graphs imply the height range was 162 to 194 cm (64” to 76”) for caucasian males and 145 to 180 cm (57” to 71”) for caucasian females. Using the extremes of these height ranges it is interesting to see how the GLFI reference equations compare to the NHANESIII reference equations.
Not unexpectedly there are pronounced differences between between the NHANESIII reference equations and the GLFI reference equations however these differences are not the same for short and for tall individuals and in fact tend to be more or less opposite.
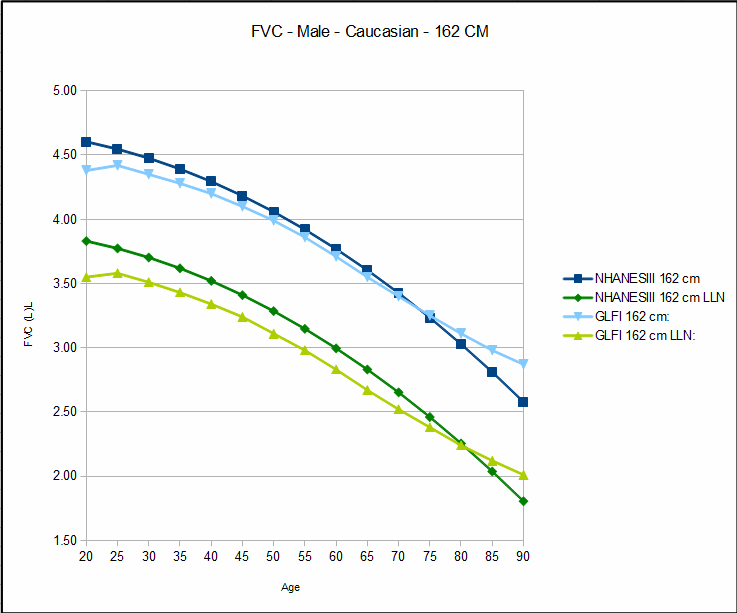
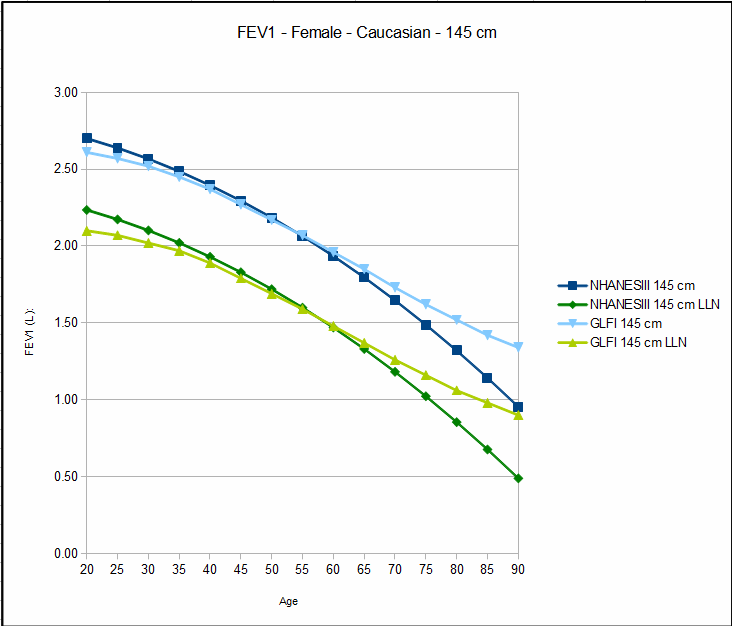
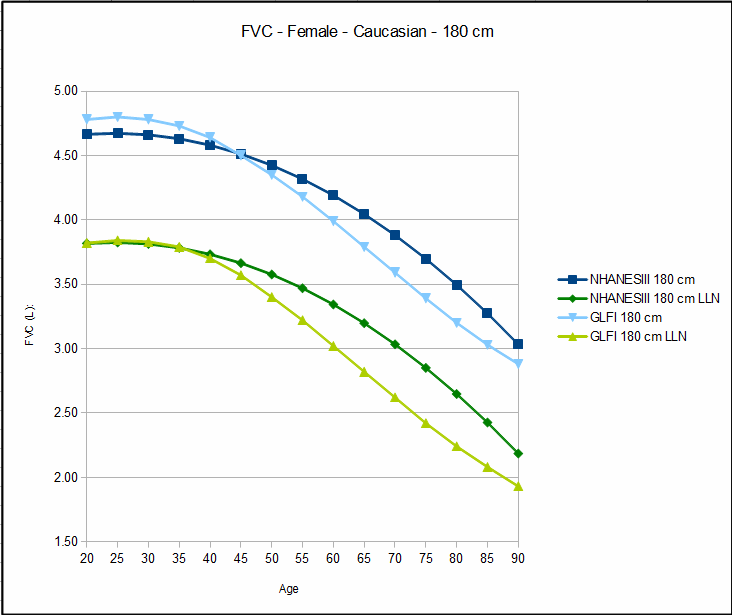
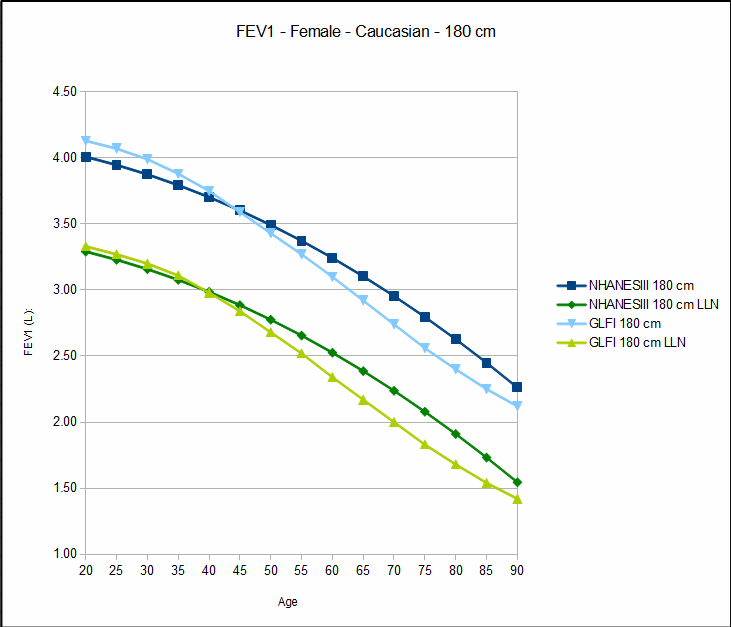
For short individuals, both male and female, the GLFI reference equations predict a lower FVC and FEV1 than do the NHANESIII reference equations earlier in life but a higher FVC and FEV1 later in life. For FVC, the NHANESIII and GLFI values intersect at about age 70 in females and about age 75 in males. For FEV1 the intersection is about age 53 in females and about age 43 in males.
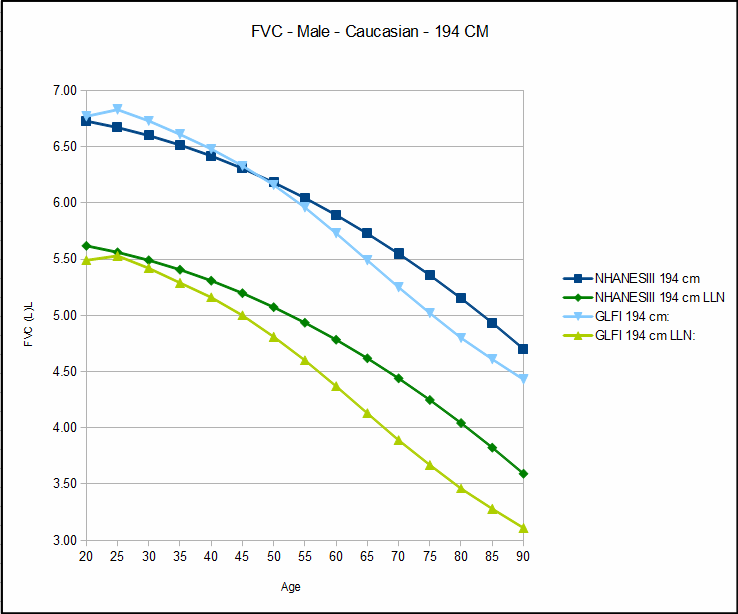
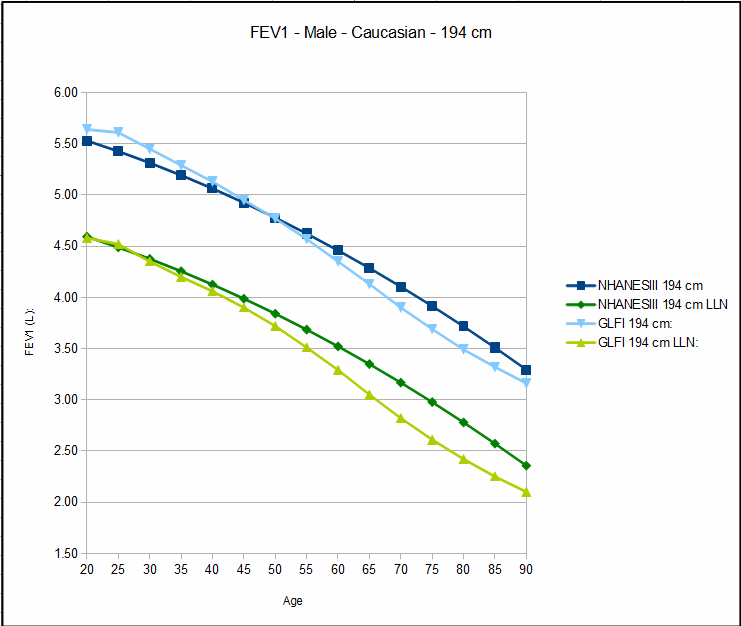
Tall individuals, also both male and female, show the opposite pattern. The GLFI reference equations predict a higher FVC and FEV1 than do the NHANESIII reference equations early in life and a lower FVC and FEV1 later in life. For FVC NHANESIII and GLFI intersect at about age 45 for females and about age 47 for males. For FEV1 the intersection is about age 45 for females and about age 50 for males.
Airway obstruction is more commonly diagnosed with the FEV1/FVC ratio than with just the FEV1. The predicted GLFI FEV1/FVC ratio is higher than the NHANESIII FEV1/FVC ratio for both sexes, heights and almost all ages. Depending on the technique used to assess FEV1/FVC ratio normalacy there is likely to be a difference in the number of patients who meet the criteria for airway obstruction.
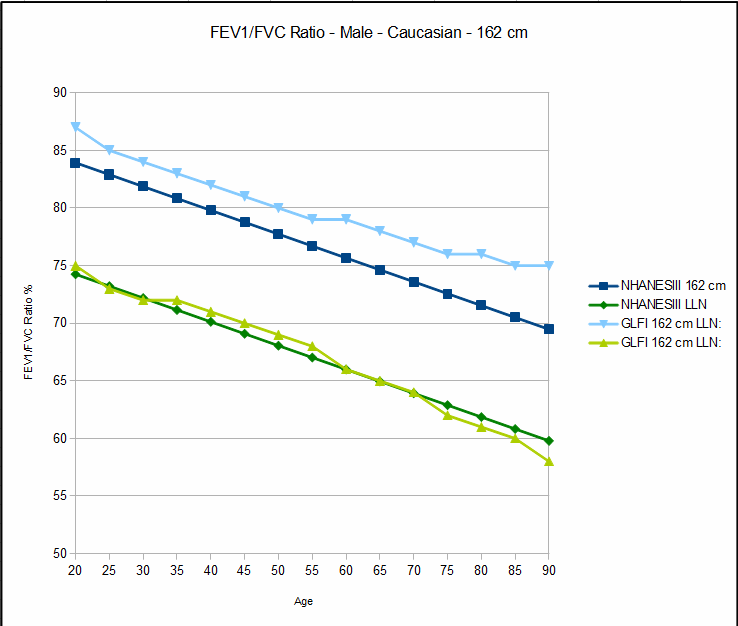
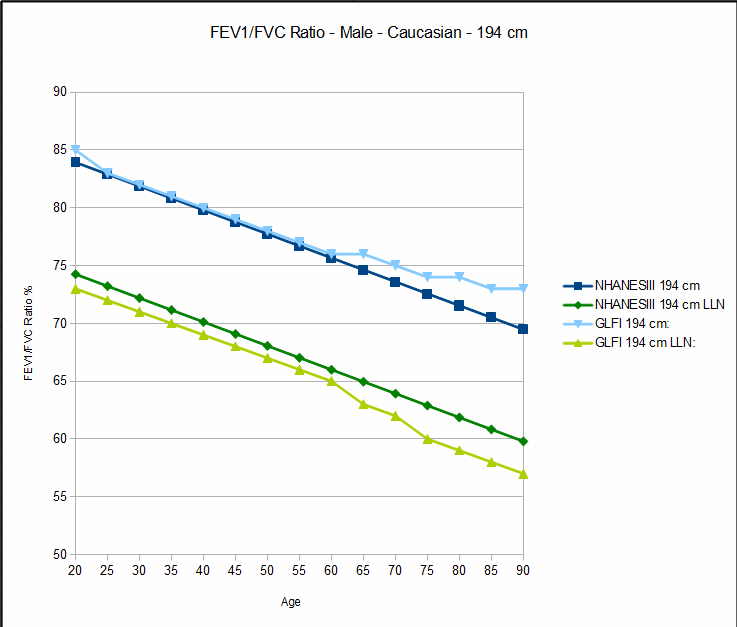
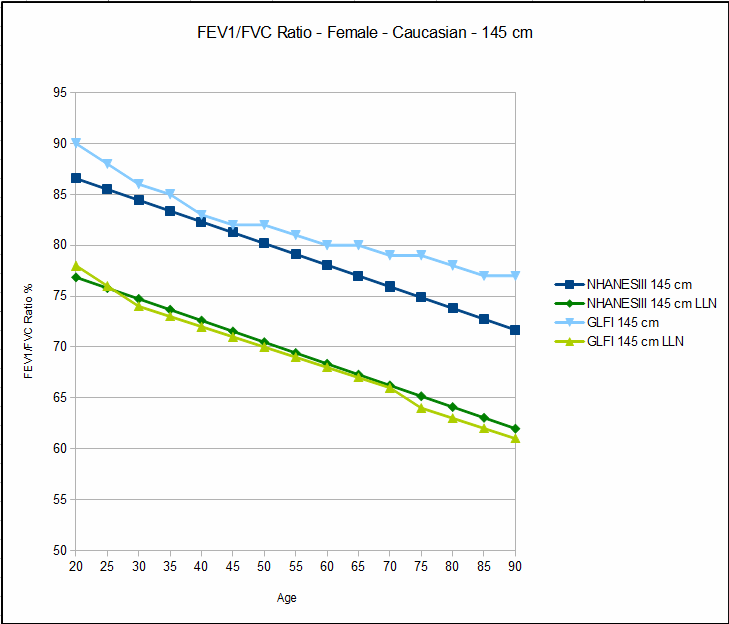
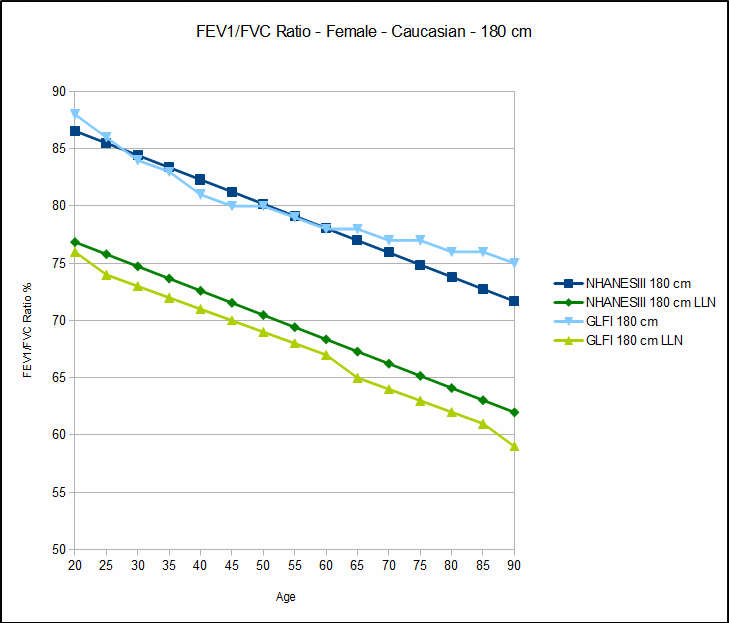
Despite the fact that the predicted GLFI FEV1/FVC ratio is higher, except for the very shortest individuals the lower limit of normal for the FEV1/FVC ratio tends to be lower than the NHANESIII LLN. When the LLN is used as the primary indicator of airway obstruction then there will likely be an overall decrease in the number of patient’s given that diagnosis.
Use of the LLN is not universal however, and there are still many PFT labs that use a fixed percentage of the predicted FEV1/FVC ratio instead. In this case regardless of where the bar has been set, there is likely to be an increase in patients diagnosed with airway obstruction.
(I will note in passing that the difference between the use of the lower limit of normal and a fixed percentage should not considered to be an argument for or against either approach. There has been substantial momentum towards the use of LLN and I understand the argument in its favor, but it is still a primarily a statistical approach with a limited amount of verification in terms of patient outcomes.)
I expect the GLFI reference equations to become the worldwide standard for all pulmonary function labs. I would appreciate having a better understanding of the lower and upper limits for height in the GLFI data set, however. When my PFT lab went through its hardware and software upgrade a year ago, we had an issue with the age range in the reference equations supplied with the software. There are, however, no particular limits on the height that can be entered for a patient and this particular aspect of reference equations seems seems to be frequently overlooked. The number of patients seen in my PFT lab that are outside the height range I’ve gotten from the NHANESIII study are small but they do exist and it would seem to be a good idea to know the credible height range for any given set of reference equations.
References:
Hankinson JL, Odencrantz JR, Fedan KB. Spirometric Reference Values from a sample of the general U.S. Population. Am J Respir Crit Care Med 1999; 159: 179-187.
Quanjer PH, Stanojevic S, Cole TJ, Baur X, Hall GL, Enright PL. Hankinson JL, Ip MS, Zheng J, Stocks J. Multi-ethnic reference values for spirometry for the 3-95 year age range: the global lung function 2012 equations. Eur Respir J 2012; 40: 1324–1343.

PFT Blog by Richard Johnston is licensed under a Creative Commons Attribution-NonCommercial 4.0 International License.