
One of the things that I enjoy most about reviewing cardiopulmonary exercise tests is that I always have to reach back into the basics of physiology in order to get a sense of what the results are trying to say. Oftentimes it isn’t so much the absolute or percent predicted value of a given parameter but its relationship with other parameters that is revealing. One of the bits of human physiology that has always struck me as fascinating is the relationship between heart rate and oxygen consumption.
For almost everyone there is a linear relationship between heart rate and oxygen consumption. When you plot them against each other you can put a ruler on the plotted points and see that they form a straight line. Chronotropic Index and O2 pulse are two ways of analyzing this relationship.
The Chronotropic Index is a measurement of the slope of the relationship between heart rate and oxygen consumption and is calculated from: ![]()
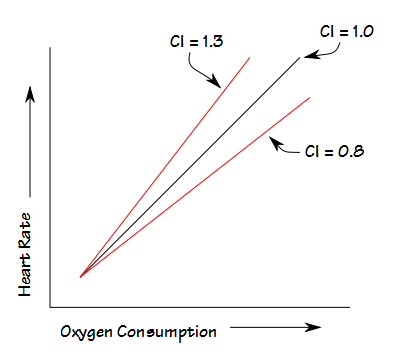
A Chronotropic Index that is greater than 1.0 indicates the heart rate is increasing faster than the corresponding oxygen consumption and one less than 1.0 indicates a heart rate that is increasing slower than the corresponding oxygen consumption. I consider 0.8 to 1.3 to be the normal range.
The Fick equation showed there is a relationship between oxygen consumption and cardiac output.
![]()
The fascinating thing to me is that despite the fact that heart rate, stroke volume, oxygen consumption and mixed venous O2 content do not change linearly during increasing exercise, heart rate and VO2 almost always maintain a linear relationship as long (and this is important) as arterial oxygen saturation (SaO2) remains normal.
O2 Pulse is simply oxygen consumption (in ml) divided by heart rate. It is usually best to look at O2 pulse in terms of percent predicted and it is used as an index of stroke volume. If you assume that the arterial and mixed venous O2 content difference remains reasonably stable, then you can re-state the Fick equation to say that
Cardiac Output ~ Oxygen Consumption
and since stroke volume is cardiac output divided by heart rate, then
Stroke Volume ~ O2 Pulse
You can’t use this to say if the O2 pulse is X then the stroke volume is Y basically because you don’t really know what the arterial-venous O2 content difference is, but you can use it as an index. Like the Chronotropic Index, O2 Pulse is useful only as long as the SaO2 remains normal.
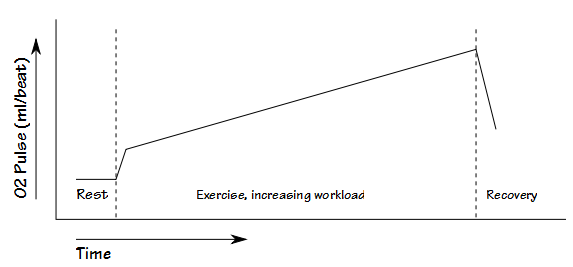
Because O2 pulse is an index of stroke volume it’s course during an exercise test looks something like this:
It might seem that the requirement that the SaO2 needs to remain normal would limit the usefulness of the Chronotropic Index and O2 pulse, but the fact is that a decreased SaO2 is by itself a clear indicator of a pulmonary (either mechanical or vascular) exercise limitation and excludes a cardiovascular limitation (at least as a primary factor). The patients that we see most often for cardiopulmonary exercise tests are ones whose routine pulmonary function or cardiac tests do not explain their shortness of breath. Patient with known pulmonary disease usually don’t need to have an exercise test (or if they do it’s to find out the precise nature of their limitation and then other values come into play anyway), and for this reason relatively few patients we test show a decreased SaO2 during testing.
It might also seem that the Chronotropic Index and the O2 pulse say the same thing, but the difference is that the O2 pulse is the relationship between heart rate and oxygen consumption at a given moment whereas the Chronotropic Index is the slope of that relationship. A results of a recent patient’s test will highlight the difference.
The patient was tachycardic at rest, with a baseline heart rate of about 120. Testing ended when the patient was SOB and said they couldn’t go any further, which also happened to coincide with their maximum predicted heart rate.
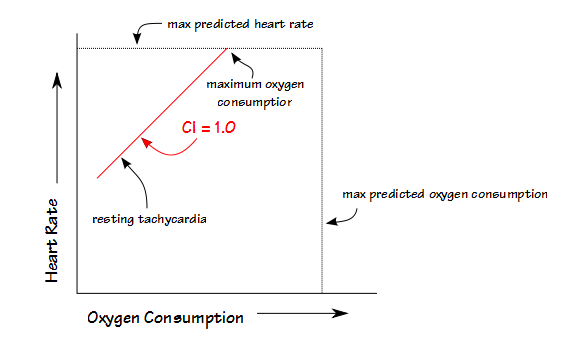
The patient had a low maximum oxygen consumption and a low maximum O2 Pulse and therefore likely had a reduced stroke volume at peak exercise, but despite this they also had a normal Chronotropic Index which meant that despite the resting tachycardia their heart rate advanced normally with exercise.
In general though, as long as a patient’s resting heart rate is more or less normal, the Chronotropic Index will also say something about their stroke volume. Very fit individuals have a large stroke volume and for this reason their Chronotropic Index tends to be low. Although I use 0.8 as a lower limit of normal, it is not totally unusual to have an exceptionally fit individual (“I’m getting short of breath after running 20 miles, something must be wrong!”) to have a chronotropic index as low as 0.65 or 0.70. What differentiates these individuals from those with chronotropic incompetence (gotta love those beta blockers!) is that their maximum oxygen consumption is also usually well above normal. In fact, for an individual that is exceptionally fit, a Chronotropic Index near 1.0 is probably abnormal.
When an individual is out of shape or deconditioned, stroke volume is usually reduced and their Chronotropic Index will be elevated and their maximum O2 Pulse will be reduced. Below a certain point, a reduced stroke volume is more likely due to an underlying cardiac dysfunction and not just deconditioning and that is where the upper limit of normal of 1.3 comes into play. When an individual has a stiff heart, a filling problem or a low ejection fraction then their stroke volume will be reduced outside the limits of normal and this will usually show up as a markedly elevated Chronotropic Index. You can suspect this when the Chronotropic index is above 1.3 but it is probably a given for 1.5 and above.
After having made the point that the relationship between heart rate and oxygen consumption is linear (as long as SaO2 remains normal!), it is when it is not linear that it can be particularly revealing. Every year we get a certain number of patients that have passed a standard cardiac ECG stress test with flying colors but are still complaining of DOE. When they have a cardiopulmonary stress test, their Chronotropic Index and O2 pulse often looks like this:
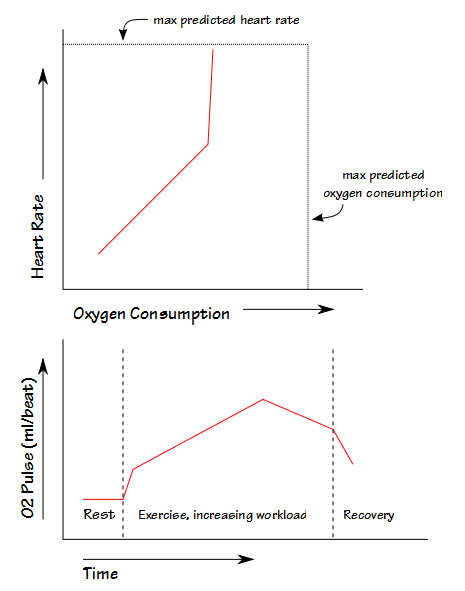
In almost every case these patients have had a problem with their heart valves. Up to a certain heart rate their heart valves were opening and closing properly but above that heart rate they weren’t. Once that occurred either their ventricles weren’t filling properly or there was regurgitation and this is called a rate-related decrease in stroke volume. Because there is often no ECG sign of this they were able to pass a standard cardiac stress test but this syndrome stands out like a beacon when you can compare oxygen consumption to heart rate.
Chronotropic index and O2 pulse can be windows into stroke volume and cardiac output and for this reason I would strongly recommend that they are calculated and that graphs of heart rate versus VO2 and O2 pulse versus time be included when a cardiopulmonary stress test’s results are evaluated.

PFT Blog by Richard Johnston is licensed under a Creative Commons Attribution-NonCommercial 4.0 International License.